Console
modak-console.jar is a strict superset of the worker binary: the same daemon
and CLI, plus an embedded web console served on MODAK_CONSOLE_PORT (default
9090). The local stack runs it at http://localhost:9090.
Zero build step, zero external services: plain HTML/CSS/JS with Apache ECharts
and CodeMirror bundled as WebJars, served from the jar.
The demo walks through the console live: tiering, cross-tier SQL, the delta fold, and an on-demand maintenance pass.
Overview
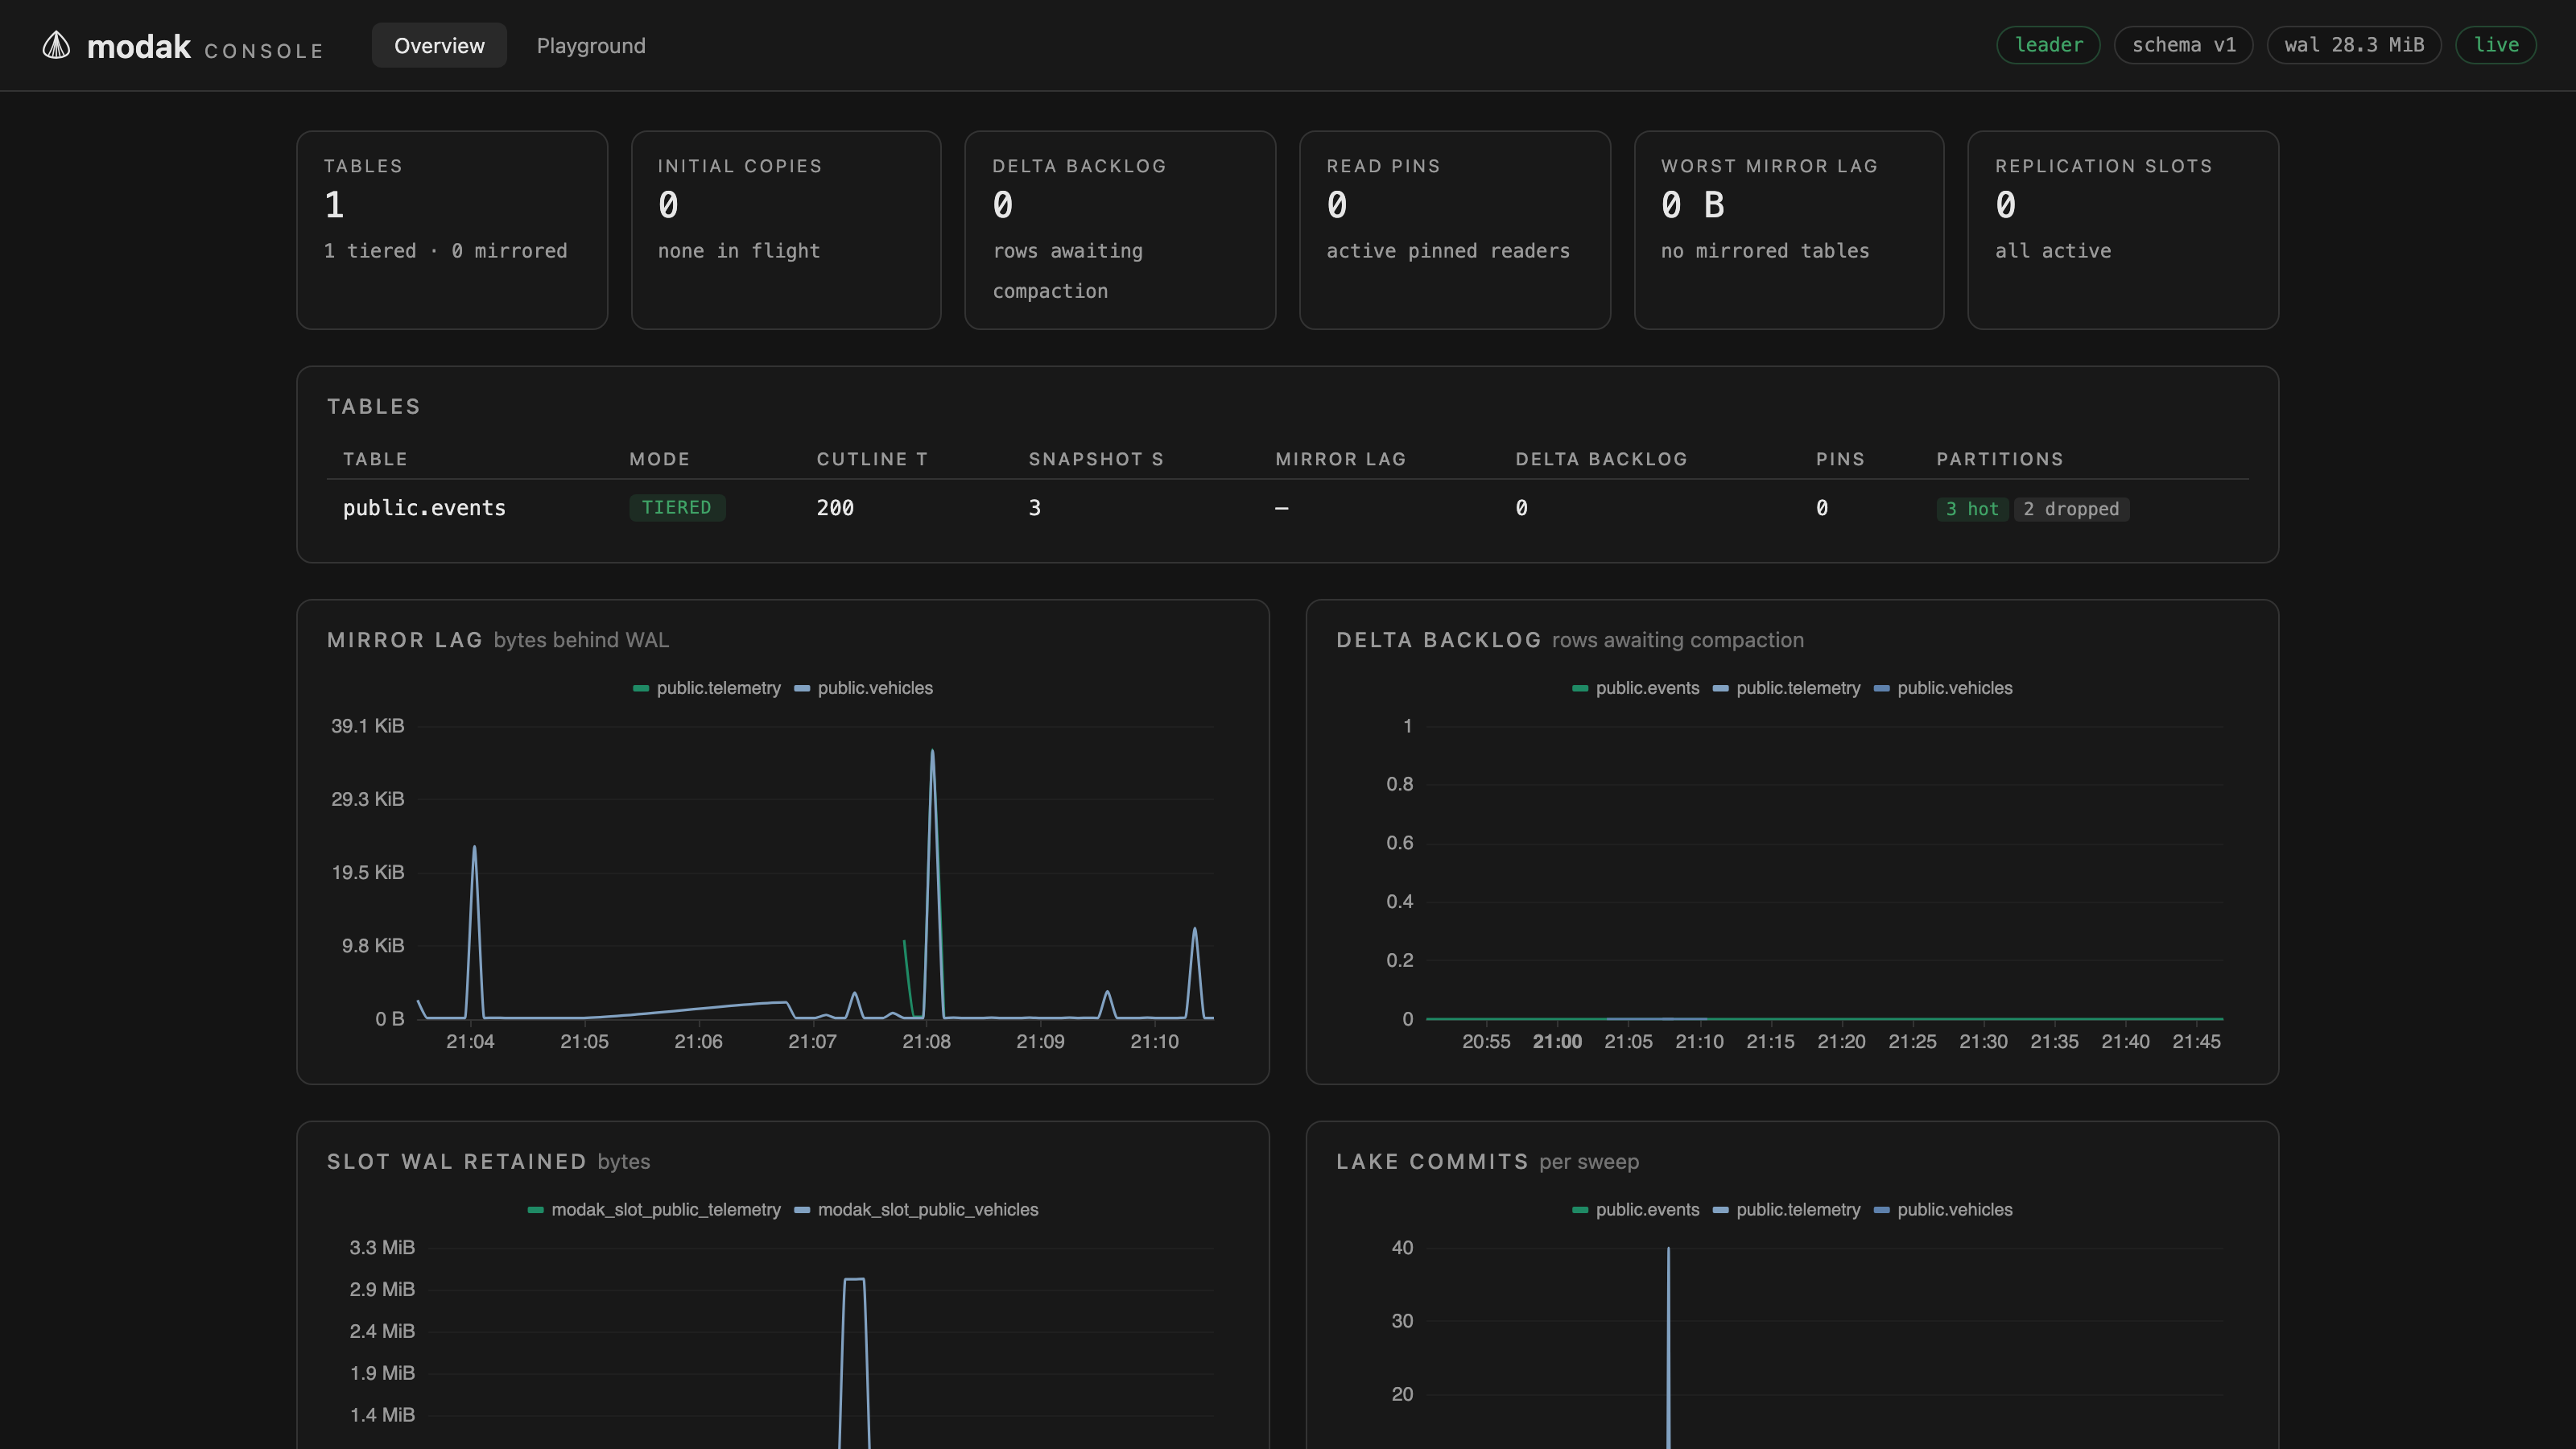
The fleet at a glance: per-table mode, cut-line, mirror lag, delta backlog, read pins, partition states, in-flight initial copies, and a lake column with each table's headline file count, size, and any active health warnings, refreshed live.
Charts for mirror lag, delta backlog, slot WAL, and lake commit rate draw from an in-process ring buffer (about 11 hours of history at the default sweep interval), so no Prometheus is required for a useful picture.
A storage-profiles table lists the configured warehouse bindings (name, format, warehouse, credential ref, default flag), and each table's detail page shows which profile it registered against. See Storage profiles.
Table detail
Drill into any table: its partitions and lifecycle states, the operation journal (tiering/compaction/maintenance phases), and replication slot detail for mirrored tables.
The lake health panel shows whatever the format plugin reports: its counters (files, delete files, snapshots, manifests, ...), active health warnings, the maintenance policy in force, and what the last maintenance pass did, with file-count and size charts alongside. The panel is format-agnostic by design, a future Hudi or Paimon plugin fills the same panel with its own numbers. See Lake maintenance.
A Run maintenance button next to the last-maintenance table files a
request (modak.maintenance_requests, requested_by = 'console'); the leader
claims it within its cycle interval, and the pass's counters appear in the
panel once journaled. The button is disabled while a request is pending.
SQL playground
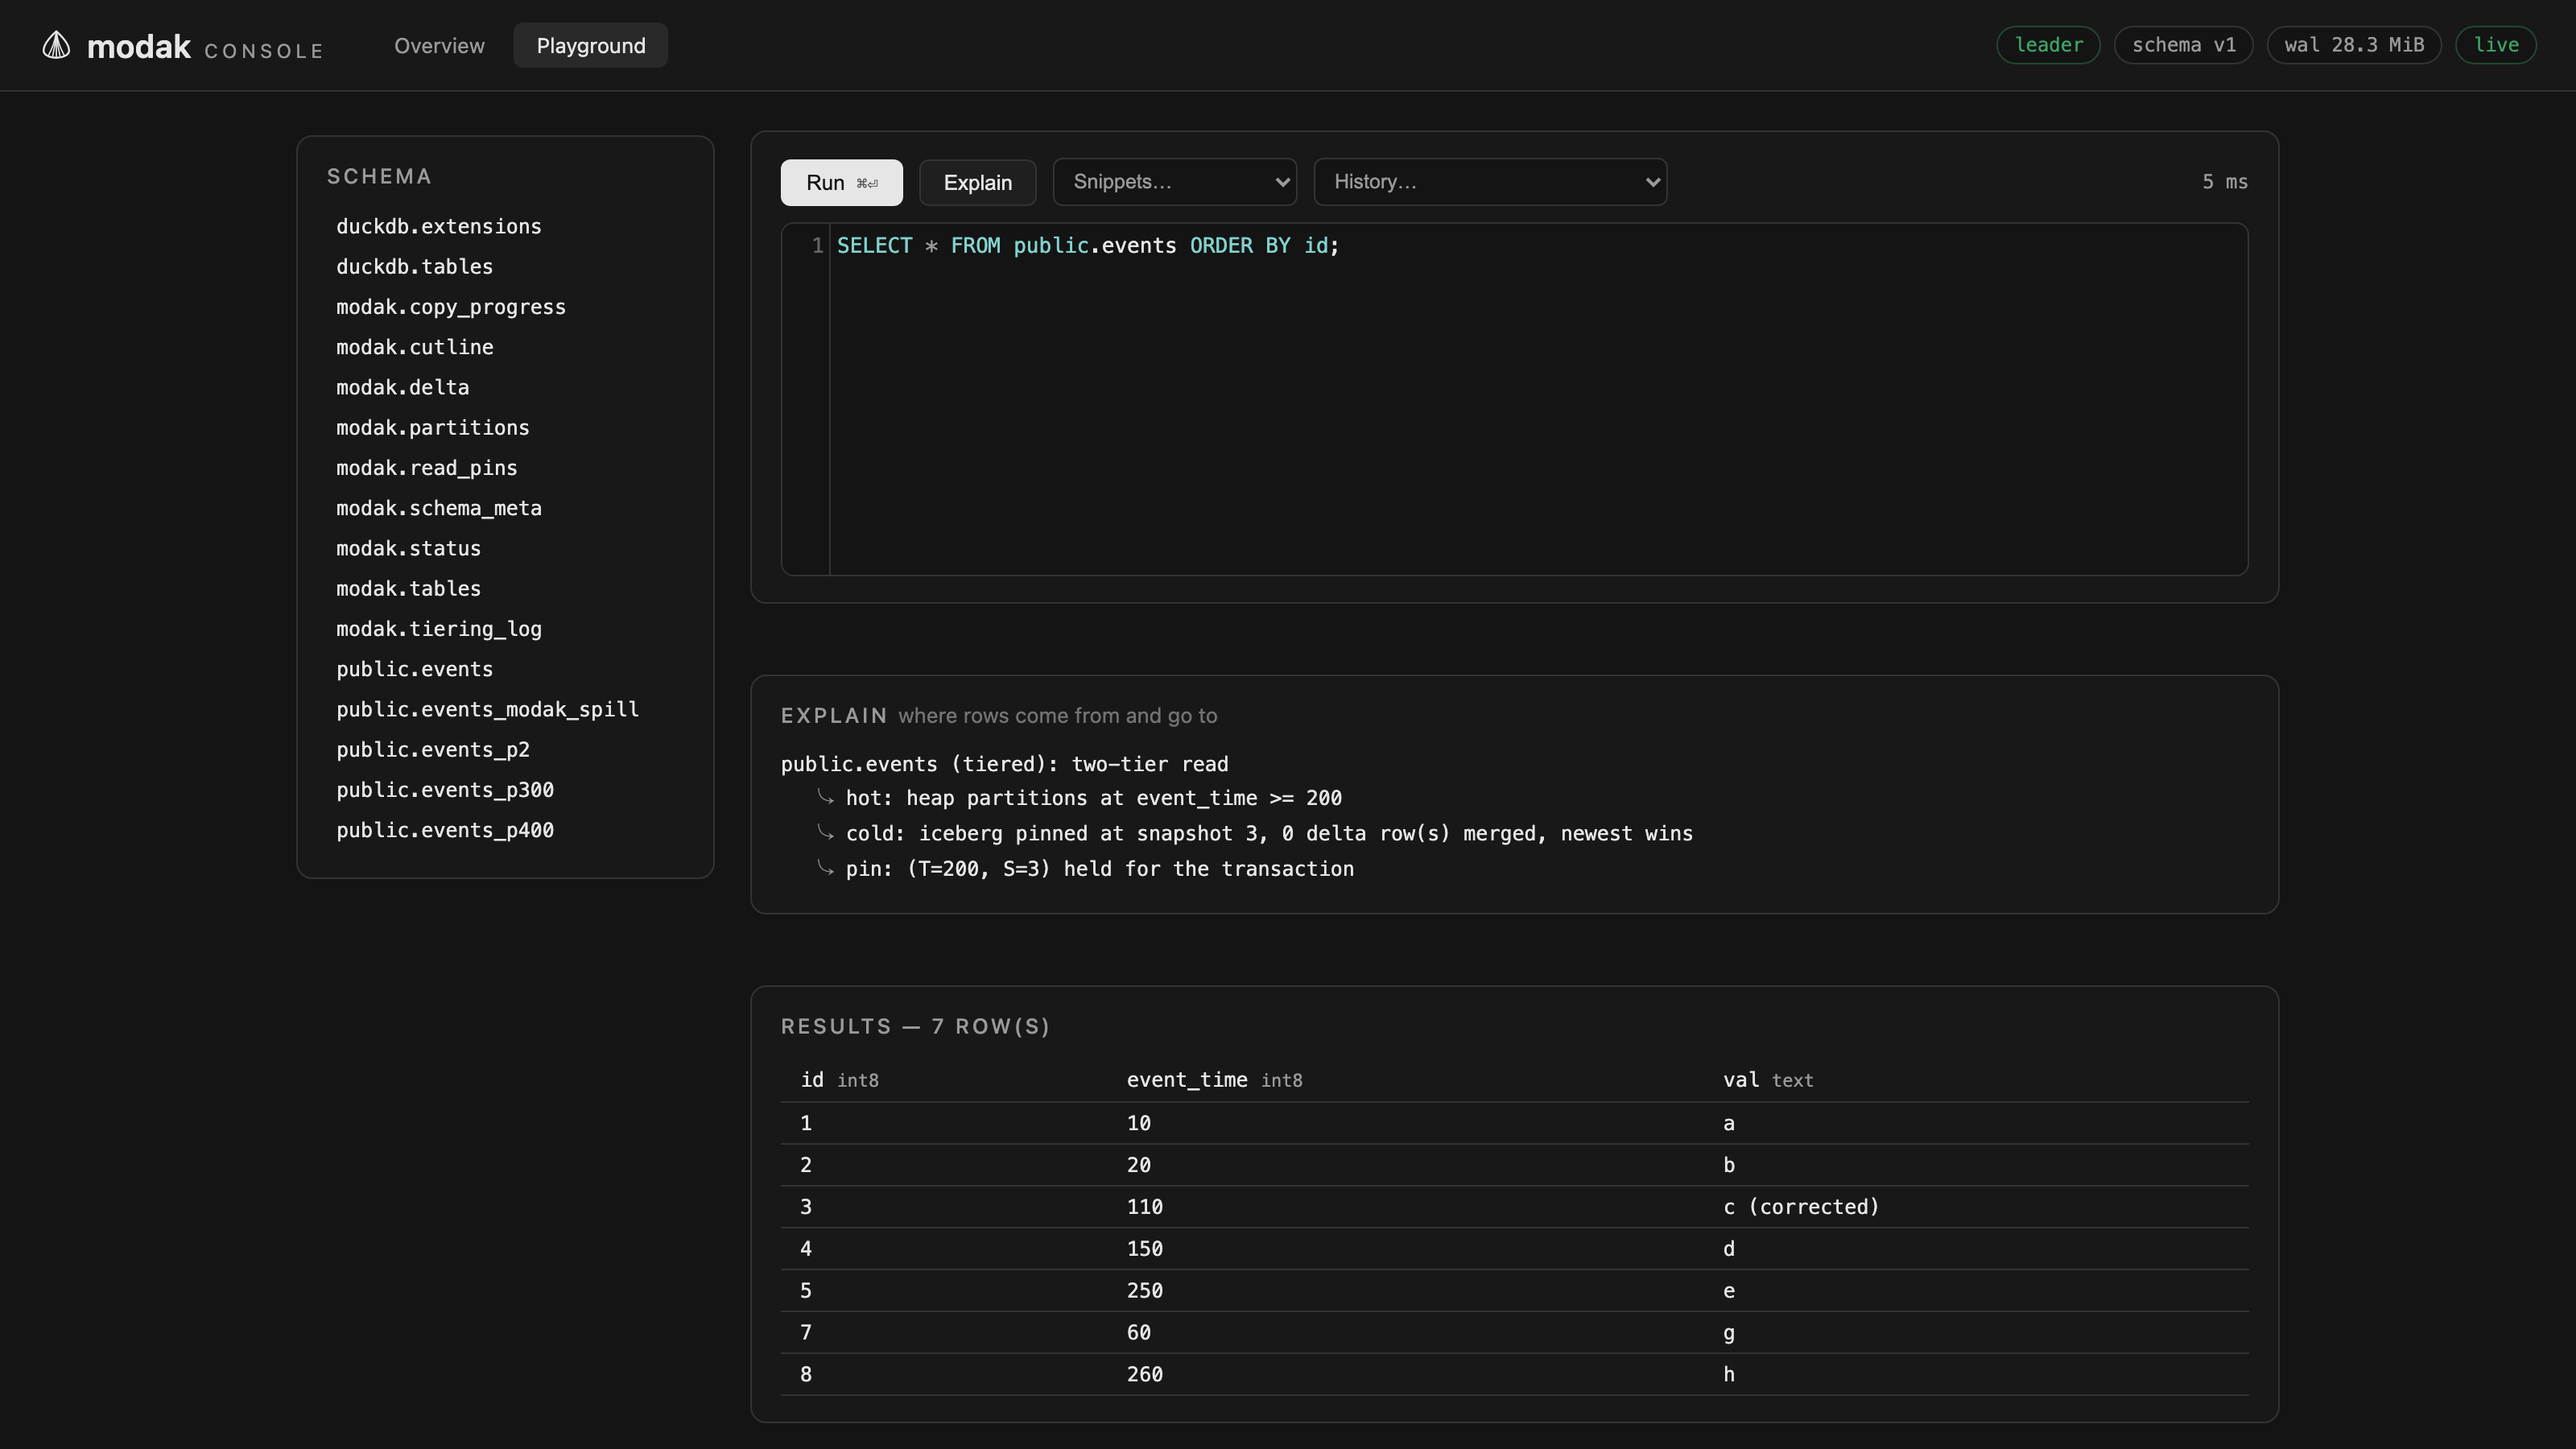
A schema browser, a CodeMirror SQL editor with snippets and history, and a
results grid. Statements run with transparent reads on, so tiered tables read
as your users see them, merged across both tiers, with a query timeout and a
row cap applied. Use it to create tables, inspect modak.*, or sanity-check
what a two-tier read returns.
The Explain button runs
modak_explain on the
statement instead of executing it, and shows where rows will come from or go
to: which tiers a read spans, whether a write passes through or splits into
hot and cold halves, and what would be rejected.
The playground is a superuser surface
Statements execute with the worker's Postgres credentials. Set
MODAK_CONSOLE_SQL=false to disable the query endpoint, or deploy the
headless modak-worker.jar, which has no console at all. Either way, keep
the port internal: the console has no TLS and no auth by design.
JSON API
Everything the UI shows is fetchable directly. The full spec is served by the
console itself at /api/openapi.yaml (also linked from the footer):
| Endpoint | Returns |
|---|---|
GET /api/v1/overview |
Fleet summary: tables, cutlines, backlogs, slots, copies, lake headlines |
GET /api/v1/tables/{id} |
One table: partitions, journal, slot detail, lake health, pending maintenance |
POST /api/v1/tables/{id}/maintenance |
Files a maintenance request for the leader's next cycle |
GET /api/v1/series |
The chart ring buffers, key -> [[ts, value], ...] |
GET /api/v1/storage-profiles |
The configured storage profiles |
POST /api/v1/storage-profiles |
Create a storage profile (only non-secret fields cross the wire) |
GET /api/v1/schema |
Schema tree for the playground browser |
POST /api/v1/query |
Run a SQL statement (disabled when MODAK_CONSOLE_SQL=false) |
POST /api/v1/explain |
Explain a SQL statement, returns the modak_explain report lines |
POST /api/load/{schema}.{table} |
Stream load a labeled micro-batch (see Stream load) |
GET /metrics |
Prometheus text format, same as the headless worker |
/metrics is served by both binaries, so Prometheus scrapes either the same
way.
In SQL instead
The same per-table picture is available without the console:
SELECT * FROM modak.status;
--  table_id | schema_name | table_name | mode | cutline_t | cutline_s |
--  mirror_frontier | delta_backlog | read_pins | copying | partition_states